
Here’s what historical data and economists’ projections say about what lies ahead for the U.S. economy, and the shape of its contraction and recovery.

There have been many analogies between the COVID recession and the Great Depression. A recent study by the Federal Reserve Bank of St. Louis [1] compared statistics on GDP, industrial output, employment and CPI between the two time periods.
Historical data, combined with economists’ consensus projections for the next one to two years, suggest that while the initial months of economic contraction in 2020 have been more severe than in 1929, the COVID-caused downturn will not be as deep or long as the Great Depression.
.
DEFINING THE BASELINE | 1929 AND 2020
The study’s author, David C. Wheelock, defines the baseline as the month or quarter that economic output peaked prior to the start of each downturn. In the Great Depression, this was 3rd Quarter 1929, or more specifically, August 1929. In the current COVID recession, he uses a baseline of 4th Quarter 2019, but if looked at on a more precise monthly basis, February 2020.

These baselines set a starting point of 100, against which subsequent months’ economic activity is measured. Whether the historical data is available on a monthly or quarterly basis dictates which baseline date is used.
.
forecasts | sPF + bLUE cHIP cONSENSUS
Two sources of economic forecasts are used:
SPF – Survey of Professional Forecasters
In existence for over 50 years, the Survey of Professional Forecasters (SPF) is managed by the Federal Reserve Bank of Philadelphia. The SPF is a quarterly survey of roughly 40 macroeconomists from financial firms and educational institutions.
Haver Analytics – Blue Chip Consensus
Haver Analytics is a consulting firm which provides databases from government and private resources for the global strategy and research community. According to their web site, Haver Analytics’ Blue Chip consensus is a compilation of forecasts for economic indicators from more than 50 leading business economists.
.
gdp recovery | 2-3 yEARS VS. 10 yEARS
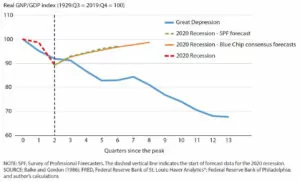
Wheelock’s line chart below shows that during the first two quarters of the COVID recession, GDP contracted even more severely than during the same period in the Great Depression.
.
Real GNP / GDP
.
GDP dropped precipitously during 2nd Quarter 2020, as states’ stay-at-home orders severely limited economic activity. As those stay-at-home orders were lifted, businesses and factories re-opened, prompting improvement in production, employment and spending. Consensus forecasts of rising GDP starting in 3rd Quarter 2020 reflect expectations of continued gains in production, employment and spending.
Those improvements could reverse if multiple COVID shutdowns occur, but consensus forecasts suggest that even in those scenarios, GDP will not drop below its 2nd Quarter 2020 trough. This would be a very different scenario than during the Great Depression, when the U.S experienced a long, sustained contraction, where GDP declined steadily over a 3+ year period. Even after 1933, GDP recovery was painfully slow. According to data from the Bureau of Economic Analysis, it wasn’t until 1940 – a full 10 years from the start of the Great Depression – that GDP once again reached 1929 levels.
 .
.
PREDICTIONS | It May Be BuMPY
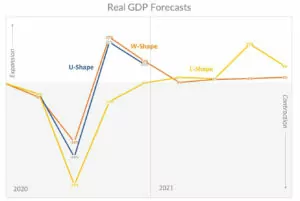
By definition, consensus forecasts represent an average of expectations, which smooths the highs and lows of individual predictions. The resulting consensus of slow but steady GDP growth starting in 3rd Quarter 2020 may be optimistic given the resurgence of the pandemic in the U.S. However, even economists with more pessimistic expectations for an L-shaped recovery (where growth is slower and more anemic) or W-shaped scenario (where COVID resurgence requires multiple shutdowns) do not forecast a drop in GDP below its 2nd Quarter 2020 trough.
..
Real GDP Forecasts – ING + Reuters
Data Sources: 2020 Real GDP Growth Forecasts by ING & Reuters – see https://reut.rs/34kX9IT,
https://reut.rs/2xfo9gI, https://reut.rs/2VlbAIW. Graphics by Admiral Real Estate. .
ADDITIONAL INDICATORS | Industrial Production
Forecasts about other indicators, such as industrial production, unemployment and CPI, also suggest a shorter recovery period during the COVID recession.
GDP measures all of the good and services produced in a country. Industrial production is a subset of GDP; it is limited to measurement of production in manufacturing, mining and utilities. Although it now represents a relatively small percentage of the overall U.S. economy, industrial production is considered an important leading economic indicator due to its sensitivity to changes in consumer demand and interest rates.
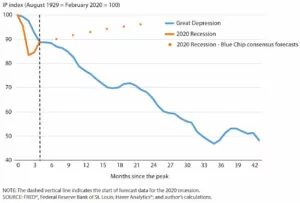
Industrial Production
.
As shown above, the course of industrial production during the Great Depression mirrored that of GDP, declining for almost 3 years. During the COVID recession, the initial drop in industrial production was extremely sharp, declining to 83% of February 2020 levels [2], as states mandated the closure of many businesses. But once those restraints were lifted, industrial production began to recover.
As of July 2020, the Industrial Production Index stands at 100.2, already recovering to 92% of the February 2020 baseline. During the Great Depression, industrial production had dropped much, much further before it began to rebound. At its trough in July 1932, the index had fallen to 47% of August 1929 levels. The index did not consistently stay above its August 1929 level until 1939.
.
RISKS | Financial Sector
SPF and Blue Chip consensus forecasts are not written in stone. Forecasts require guesswork, and tend to be less accurate the further the time horizon. They may not take into account unforeseen events.
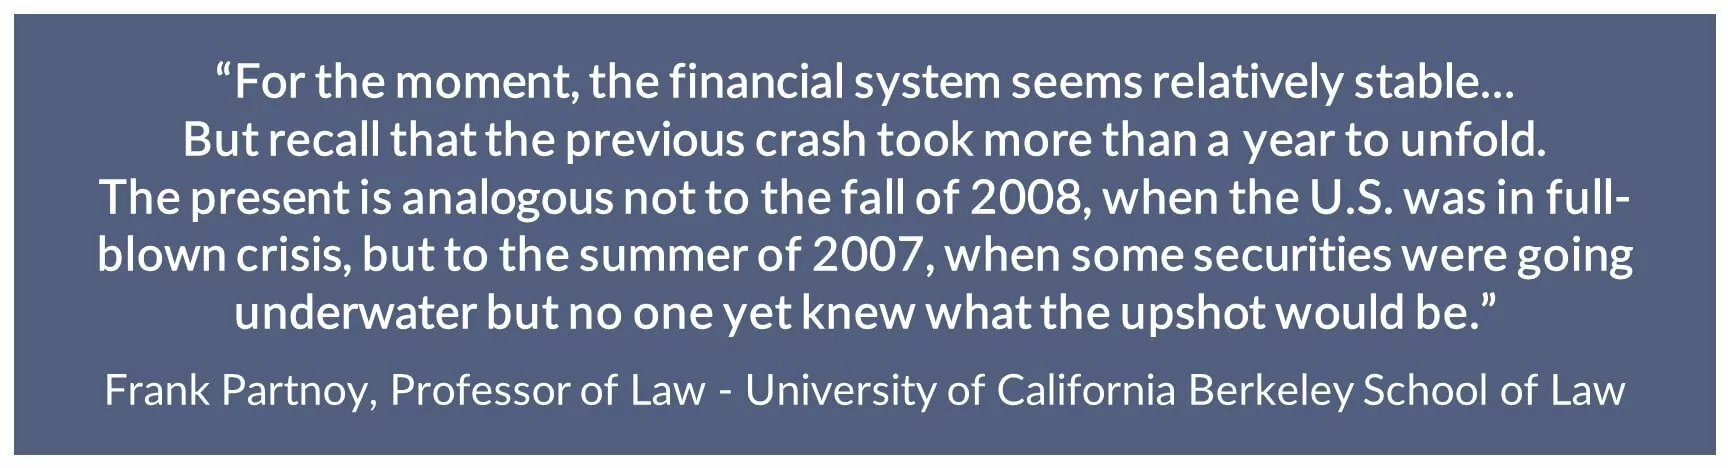
One such risk, outlined in a recent article in The Atlantic by Frank Partnoy, a Professor of Law at the University of California Berkley School of Law, is the potential for a bank collapse prompted by large-scale corporate defaults. While the 2008 banking crisis was set off by home mortgage defaults, the author argues that today’s parallel could be defaults on corporate loans packaged as collateralized loan obligations, or CLOs. As many of the loans composing CLOs are high-risk, sharp deterioration in the business environment cause by COVID could push many of these loans into default.
.
Although banks have been required to maintain higher capital reserves since 2008, Portnoy reports that the Financial Stability Board estimates that, for 30 global banks, exposure to CLOs and other leveraged loans is quite high, averaging somewhere near 60% of capital reserves.
.
MITGANTS | Gold, Government Relief + Trade
If such a collapse did occur, the recession would be deeper and longer than currently forecast, and its reach global. Yet the recovery trajectory may well be closer to post-2008 than post-1929, due to the following differences between 1929 and 2020:
— Since 1973, the U.S. is no longer on the gold standard, as it was in 1929. As noted recently in the New York Times by Steven Rattner, former counselor to the Treasury secretary, “the gold standard [was] a significant culprit in deepening the Great Depression…By rigidly fixing prices to a single commodity, a gold standard exaggerates economic swings, on balance for the worse.”
— While by no means assured, government relief is another possible moderating factor. 2008’s prompt $700 billion Troubled Asset Relief Plan (TARP) helped to stabilize the U.S. financial system, in contrast with President Herbert Hoover’s slow and tepid response to economic problems in the early 1930’s. Response to the COVID crisis has been swift and significant. Globally, governments provided stimulus to the tune of over $10 billion [3] during the first two months of the crisis, three times the amount provided in 2008.
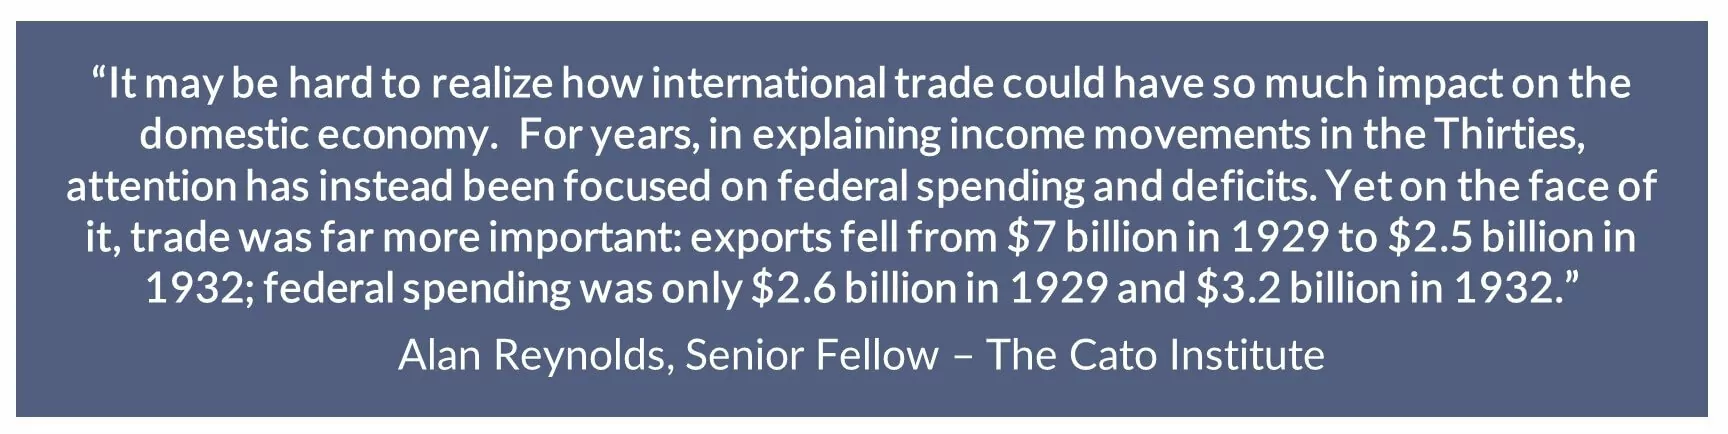
— The Great Depression was exacerbated by (or, according to some, precipitated by) the passing of the 1930 Smoot-Hawley Tariff Act [4], which added significant tariffs of roughly 20% to already high tariff levels, slowing industrial production and trade. Between 1929 and 1932, exports fell from $7 billion to $2.5 billion.
.
COVID-19 | The Shape of Contraction & Recovery
Until we are able to achieve herd immunity, a widely available vaccine, or other mitigant for COVID, the path of the coronavirus will be the biggest predictor of how recovery – or regression – unfolds. But initial data suggests that the similarities between the COVID recession and the Great Depression will prove only partially true. The initial dramatic slowdowns are analogous. The shape of recovery is likely to be quite different..
________________________________________________________________________________
.
[1] David C. Wheelock, “Comparing the COVID-19 Recession with the Great Depression,” Economic Synopses, No. 39, 2020. https://doi.org/10.20955/es.2020.39
[2] Board of Governors of the Federal Reserve System (US), Industrial Production Index [INDPRO], retrieved from FRED, Federal Reserve Bank of St. Louis; https://fred.stlouisfed.org/series/INDPRO, August 19, 2020.
[3] McKinsey & Company, “Total stimulus for the COVID-19 crisis already triple that for the entire 2008–09 recession” https://mck.co/3hr52lC, June 11, 2020.
[4] Alan Reynolds, Cato Institute, “The Smoot‐Hawley Tariff and the Great Depression”, https://www.cato.org/blog/smoot-hawley-tariff-great-depression, May 16, 2016
.
.For more information, please contact Jonathan Gordon, President/CEO or call 914.779.8200 x115
PROPERTIES
The Admiral Difference
SERVICES
Admiral Real Estate Services Corp. is a commercial real estate brokerage firm offering retail and office leasing, tenant representation and investment sales services. Based in Westchester, the company currently lists and/or manages over 100 retail, office and development properties in the New York metropolitan area.
_________________________________________
.Tags: COVID-19, COVID Recession, The Great Depression, The Shape of Recovery, New York City suburbs, Westchester County commercial real estate, Fairfield County commercial real estate, Bronx County commercial real estate, Westchester investment sales, Fairfield County investment sales, Bronx investment sales
.