
The coronavirus pandemic has cause a negative supply and demand shock unlike anything we have experienced in modern times. In this blog, we look at the likelihood of inflation vs. deflation vs. a return to relative equilibrium.
Inflation vs. Deflation Post-Covid: Economists Disagree
Among the many things Covid-19 has taken from us is the soft economic landing that might have been ours.
Instead, we have been thrown into a negative supply and demand shock, unlike anything we have experienced in modern times. How quick – and how balanced – the recovery of supply and demand is will affect whether our economy could see inflation vs. deflation, stagflation, or a return to relative equilibrium.
There are many resources available to explain why one particular scenario is likely, but we had difficulty finding a more inclusive comparison of opposing views. In an effort to provide ourselves, our clients and our readers with a broader perspective, we’ve attempted to summarize the arguments from a number of recent articles assessing the likelihood of various possible economic outcomes from the coronavirus pandemic.
FORSYTH: High Debt Makes Inflation Inevitable
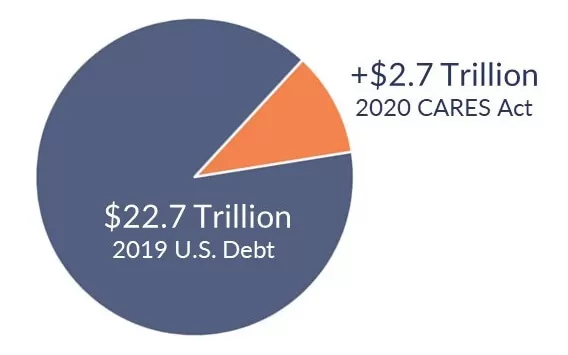
In “Expect the Unexpected after the Crisis: Inflation” [1], Randall Forsyth, Associate Editor at Barron’s, argues that the huge $2.7 trillion CARES Act federal stimulus will balloon U.S. deficits by a “staggeringly high” 14% of GDP, which ultimately will result in inflation in the medium to long term.
Mr. Forsyth agrees with the general consensus that a fiscal stimulus equivalent to wartime expenditures is needed. But he notes that “wartime finances that balloon budget deficits and that are covered by money-printing have proved inflationary throughout history.”
He believes inflation won’t be immediate. Initially, prices will be suppressed by high unemployment and dropping commodity prices, including oil. However, upward price pressure will prevail due to supply constraints: first, by the negative supply shock of reduced manufacturing and services brought on by stay-at-home orders, and then by the effects of de-globalization.
“Prepare for a world very different from that of the past four decades, with rising inflation and interest rates.”
MILES + SCOTT: Recent History Shows That Inflation is Not a Given
Comparing our current situation to historical pre- and post-war eras, economics professors David Miles and Andrew Scott make the case that inflation is not a given after Covid [2].
While there are many unknowns in how – and how fast – economies will re-open after Covid, one thing is certain: recent fiscal stimulus packages will leave us with close to wartime level deficits, in conjunction with an expansionary monetary policy. The gist of the argument for inflation is that as economies re-open, demand will rebound faster than supply. This imbalance, combined with high debt and increased money supply, will push prices higher.
From the perspective of Messieurs Miles and Scott, this imbalance between demand and supply may not materialize. In fact, they postulate that inflationary and supply and demand forces in the post-Covid world will be materially different from those in historical post-wartime economies. (Although they utilize data from the United Kingdom in their analysis, Admiral has charted relevant U.S. data below.)
To begin with, the authors argue that because of the nature of infectious disease, economies are likely to re-start gradually after Covid. This is in contrast to the more dramatic economic surges that occurred after time-specific events such as the end of a war. If return of demand is, in fact, gradual after Covid, supply may well have enough time to keep pace with demand.
In addition, Miles and Scott note that supply and demand were in relatively balance before Covid, and inflation was manageable – near central banks’ targets. In contrast, during WWI and WWII, inflation had already begun to rise well before the end of each war, as the changeover to manufacturing ‘war goods’ had already reduced the supply of non-war goods.
Finally, they believe production will recover faster post-Covid than post-war, as “war also results in mass physical destruction of capital and a tragic heavy loss of life of those of working age. Thankfully this time does for once look to be different.”
In the U.K., government debt is expected to increase by 10%-30% of GDP to roughly 100% GDP [3] over the next 12-18 months. Miles and Scott note that because this remains starkly lower than debt incurred during WWI and WWII (137% and 259% of GDP, respectively), its effect should be more muted.
When reviewing the U.S.’s historical ratios, the same comparison is more troubling, as the U.S. debt to GDP ratio will soon be reaching post-WWII levels. The $2.7 trillion CARES Act will add roughly 14% to the U.S. debt to GDP ratio, which stood at approximately 107% in 2019. The resulting 120% is still high by historical standards, equivalent to the ratio at the end of WWII.
.
CPI vs. Debt to GDP Ratio: 1930-Today
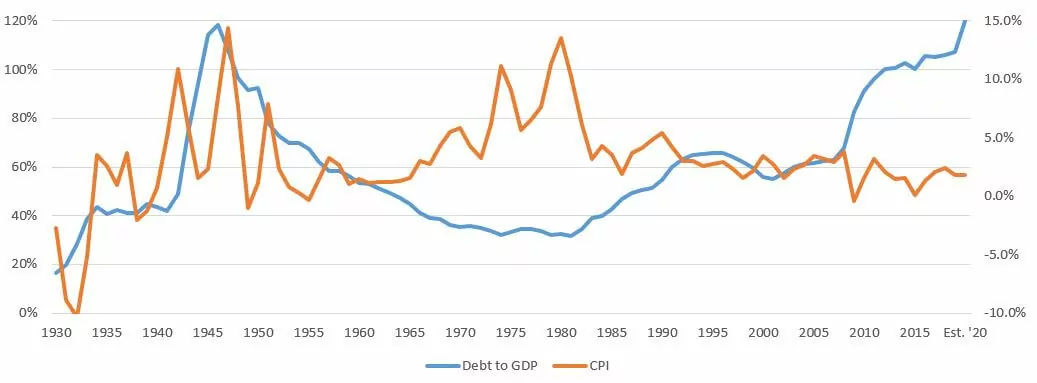
Data Sources: Federal Reserve Bank of Minneapolis (CPI), Federal Reserve Bank of St. Louis (GDP)
& TreasuryDirect (Government Debt). Graphics by Admiral Real Estate.
That being said, over the last 50 years, U.S. CPI has not shown a positive correlation with debt, which supports Miles’ and Scotts’ argument that inflation is not inevitable during periods of high government debt. For instance, the American Recovery and Reinvestment Act of 2009 of just under $1 trillion did not result in inflation. Although the $2.7 trillion CARES Act is indeed higher, and tax revenue is falling, the authors contend that debt can be paid off over a long term, and that reductions in value of private assets will also restrain inflation by limiting spending and demand.
“As yet unknown events or…policy mistakes, revealed ex post, may trigger a wave of future inflation. But they may equally trigger even greater problems of low inflation. A higher inflation future is far from inevitable.”
.
SHILLING: Slow Growth Will Trigger Deflation
Gary Shilling, president of A. Gary Shilling & Co., a New Jersey consultancy, argues in Bloomberg Opinion [4] that it isn’t debt that will dictate whether we will see inflation. Rather, the next decade will define a new normal, where it is slow growth, rather than high debt, that has a greater effect. According to Shilling, slow growth will significantly increase the risk of deflation. Reasons include:
- De-globalization’s trade barriers will spur self-sufficiency, but not domestic job growth.
- Face-to-face interactions will decline as a result of our experiences with Covid. There will be more working from home, and significantly less business and personal travel. Although this will help communications and technology companies, it will harm the airline and travel industries.
- Consumers, the primary drivers of the U.S. economy, will hold back on purchases.
- Additional fiscal stimulus will be needed.
- Despite reduced production, global supply will continue to outpace global demand.
- In the next several years, higher government spending, particularly for health care, is likely. Any tax rate increases will further dampen consumer spending.
- Recession-related bond and debt defaults will result in a tightening of lending standards.
- Stock market declines will keep jittery investors out of the stock market. Stocks may rebound more slowly than the economy, as price to earnings ratios rebalance to lower historical norms.
“Once the coronavirus is defeated, the new normal will be marked by much slower growth, the risk of deflation and a distrust of equities.”
KLIESEN: Data Signals About Deflation Are Mixed
From the Research Division of the Federal Reserve Bank of St. Louis, Business Economist and Research Officer Kevin Kliesen reviews Federal Reserve Economic Data (“FRED”) to assess the likelihood of deflation [5].
On a monthly basis, FRED generates what the St. Louis Fed dubs a “Deflation Probability Measure”, or DPM, which is meant to predict the likelihood of deflation over the ensuing year:
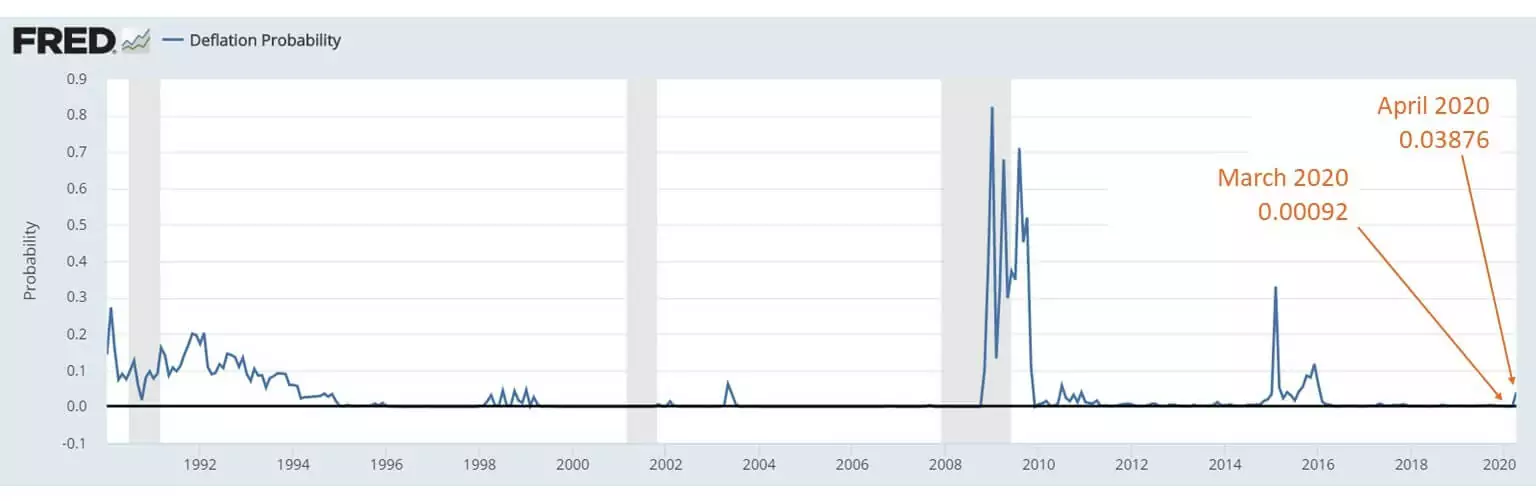 Source: Federal Reserve Bank of St. Louis, Deflation Probability [STLPPMDEF], retrieved from FRED, Federal Reserve Bank of St. Louis; https://fred.stlouisfed.org/series/STLPPMDEF, April 23, 2020.
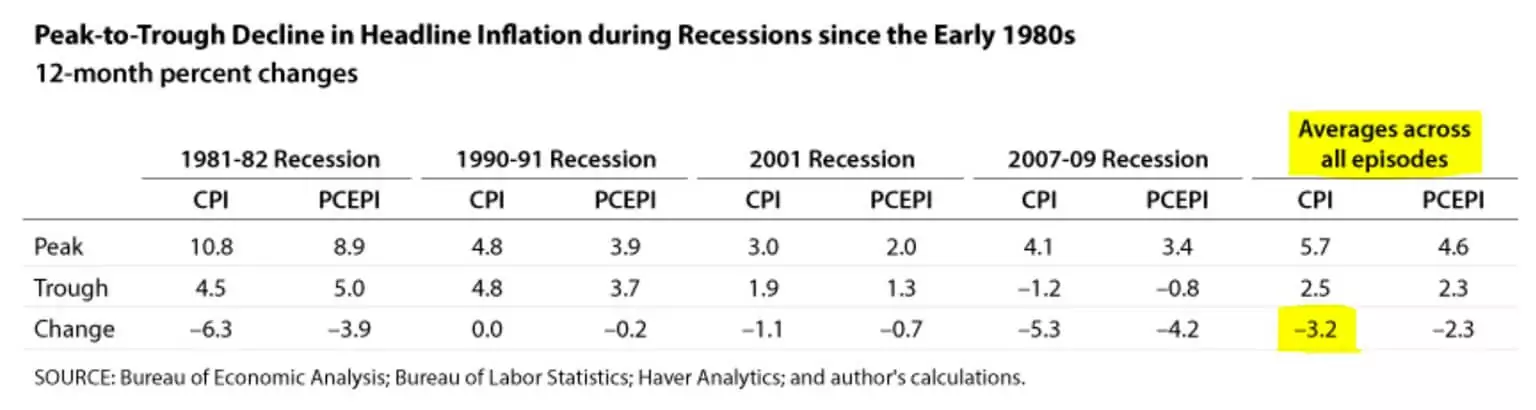
The DPM measure showed an increase in risk of deflation between March and April, albeit at still low figures which indicate limited risk of deflation over the next 12 months. However, Kliesen notes that during the last four recessions, there was an average decline in CPI of -3.2%. If one were to apply that average -3.2% change in CPI to March 2020’s already low CPI (2.3% in the year to February 2020), CPI would drop into negative numbers. How damaging such a deflationary period could be depends in large part on its duration.
In summary, Kliesen believes that the sudden and dramatic nature of the downturn, combined with plummeting oil prices, could result in deflationary pressures. However, depending on the length and severity of the downturn, these deflationary pressures could be short-lived, as they were in the Great Recession.
Kliesen notes that like the DPM, other indicators such as Treasury inflation-protected securities, do not suggest a prolonged deflationary period:
“After all, market-based measures of inflation expectations, as gauged by Treasury inflation-protected security yield spreads over the next five years, are currently at 0.9 percent. That’s low, but it’s still positive.”
BURTON: Supply Shock Will Cause Stagflation
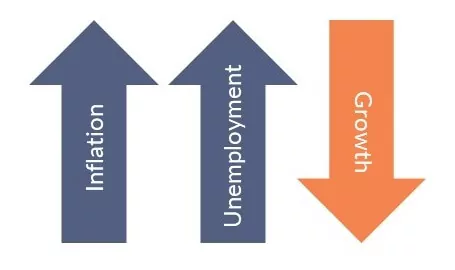
Stagflation occurs when the economy is stagnant while inflation rises amidst high unemployment.
None good in themselves, the combination is particularly alarming because it is difficult to address with monetary and fiscal policy. Monetary policy generally targets lower interest rates to spur the economy and higher interest rates to reduce inflation, but of course both cannot be targeted simultaneously.
Similarly, expansionary fiscal policy intended to accelerate the economy, such as lower taxes and increased government spending, would also be expected to exacerbate already high inflation. In the same way, constrictive fiscal policies intended to lower inflation would have the negative consequence of further slowing a sputtering economy. An additional limitation of fiscal policy – whether during stagflation or otherwise – is the significant time lag involved.
Although stagflation has been rare outside the 1970s, a recent article in the National Review by Edwin Burton [6] argues that the severity of the Covid-19 supply shock will overshadow government attempts at intervention.
The oil embargo, which increased oil prices, reduced production and slowed the economy, is widely blamed for the onset of 1970s stagflation. Burton argues that the severity of the Covid stay-at-home orders have resulted in a stop, not just in a slowdown, in production. Essentially, many forms of production have been deemed illegal for a period of time.
This supply shock is so widespread and so steep – he calls it an economic collapse – that he feels it cannot be effectively addressed by the stimulus packages being put in place in the U.S. and Europe, despite their massive size.
“Stimuluses cannot increase real output in an economy where such an increase is forbidden by law.”
RANASINGHE + CARVALHO: The Shape of Recovery
There are myriad unknowns in this early stage of Covid-19, and the virus’ path will dictate when, and by how much, economies begin to reopen. Governor Cuomo of New York State, where Admiral is based, has just announced plans for a phased-in reopening, which will being in mid-May, but may take months to realize.
Across the country and around the world, these phase-ins hope to return economies to a more normal level of output and production, a necessary step to recovery. How close to or how far from normal the demand side returns is the other side of the balance equation. Given the many uncertainties, both are of course difficult to predict.
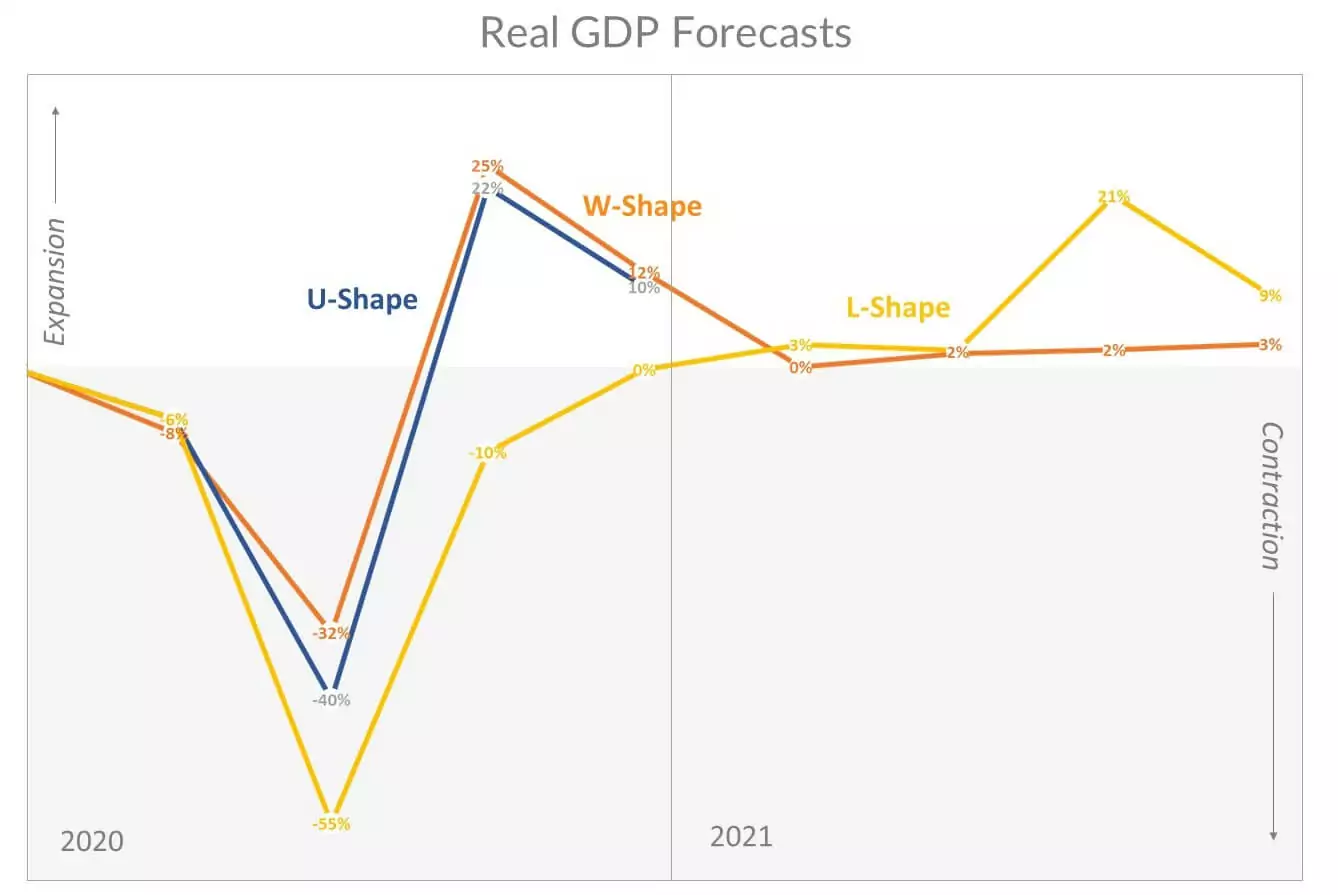
A recent Reuters article [7] outlines various projections about the shape of economic recovery. The shapes of these hypothetical recoveries, ‘V’, ‘U’, ‘W’, ‘L’ and ‘Swoosh’, are formulated based on assumptions about the intensity and duration of the trough, as well as the relative strength of return of demand. To better understand how they compare, we’ve overlaid into a single chart three of the scenarios below.
(Please note that in the below chart, we didn’t change any of the initial projections for the first quarter, even though U.S. Bureau of Economic Analysis just published data showing a -4.8% GDP decline for first quarter. The projections were already close to reality. Keep in mind, though, that first quarter figures only include a week or so of stay-at-home policies. The second quarter will include the effects of stay-at-home and phase-in policies of up to three full months, which is why the trough shown in the second quarter is so deep.)
.
 Data Sources: 2020 Real GDP Growth Forecasts by ING & Reuters – see https://reut.rs/34kX9IT, https://reut.rs/2xfo9gI, https://reut.rs/2VlbAIW. Graphics by Admiral Real Estate. Quarter on quarter % annualized.
.
- Not shown above, a V-Shape recovery is deemed a best-case scenario, where stimulus packages are able to reduce the severity of the trough and encourage a speedy recovery. Given the length of initial stay-at-home orders and a slow expected phase-in, this is now generally considered an unlikely scenario.
- The blue U-Shape is ING’s base-case scenario. The trough is deeper and the recovery takes longer.
- The orange W-Shape is the double-dip scenario, where 2nd or 3rd Covid lockdowns are required, or where additional economic fallout from the initial lockdown becomes evident during the 2nd dip.
- The yellow L-Shape is a pessimistic scenario where multiple lockdowns are necessary and demand takes a long time to recover.
- Also not shown above, the Swoosh has a sharp contraction similar to the L-Shape. While the Swoosh’s downturn is shorter, the ensuing recovery is slow and anemic.
“Of more than 50 economists polled by Reuters, some forecast the world economy will shrink as much as 6% in 2020. The other extreme was a prediction for 0.7% growth. The average was a 1.2% contraction.”
What These Scenarios May Mean For Commercial Real Estate
The above figures represent averages for the overall economy, but recovery will look very different between companies and industries. Obvious examples are medical equipment, PPE and disinfectants, which have seen a spike in demand. In contrast, air travel and tourism are experiencing an extremely sharp contraction, and will likely take much longer to return to ‘normal’.
The path of the coronavirus will determine how recovery progresses. In addition, employment figures will be a crucial measure to watch. Consumer spending represents 70% of the U.S. economy. Employment levels will indicate not only how effectively production and supply improves, but also how quickly and robustly demand returns.
It is too soon to judge what this will mean for commercial real estate in the New York metro area, where Admiral focuses on commercial leasing and investment sales. There will be substantial lost income on all sides – for landlords, tenants, managers and leasing agents. Service-oriented retailers that were the driving force behind leasing only three months ago will be hard hit.
But there may be pockets of opportunity. Office space outside of Manhattan could benefit from increased demand as workers avoid the most populous places. Retail will suffer, but strong operators could emerge even stronger, and smaller stores could benefit if consumers favor shopping local as a result of the pandemic. If stock market volatility or declines continue, investors will look for alternative asset classes (and possible inflation hedges) such as real estate.
We’ll take another look at the data in several months when more is known about the coronavirus, stay-at-home orders, and employment.
________________________________________________________________________________
[1] Randall W. Forsyth (2020, March 27). Expect the Unexpected After the Crisis: Inflation. Barron’s. https://www.barrons.com/articles/expect-the-unexpected-after-the-crisis-inflation-51585323090
[2] Miles, David and Andrew Scott (2020, April 4). Will Inflation Make a Comeback After the Crisis Ends? VOX CEPR Policy Portal. https://voxeu.org/article/will-inflation-make-comeback-after-crisis-ends
[3] Trading Economics – https://tradingeconomics.com/united-kingdom/government-debt-to-gdp
[4] Shilling, A. Gary (2020, March 20). A Look at Economies and Markets after Covid-19. Bloomberg Opinion. https://www.bloomberg.com/opinion/articles/2020-03-20/coronavirus-a-long-term-look-at-economies-and-markets
[5] Kliesen, Kevin L. (2020, April 9). The Year of Living Dangerously: The COVID-19 Shock and the Probability of Deflation. Research Division of the Federal Reserve Bank of St. Louis. https://research.stlouisfed.org/publications/economic-synopses/2020/04/10/the-year-of-living-dangerously-the-covid-19-shock-and-the-probability-of-deflation
[6] Edwin T. Burton (2020, April 9). The Economics of the 2020 Stimulus Packages. National Review. https://www.nationalreview.com/2020/04/coronavirus-relief-economics-stimulus-package/#slide-1
[7] Ranasinghe, Dhara and Ritvik Carvalho (2020, April 9). Alphabet soup: How will post-virus economic recovery shape up? Reuters – https://www.reuters.com/article/us-health-coronavirus-economy-graphic/alphabet-soup-how-will-post-virus-economic-recovery-shape-up-idUSKCN21R242
.For more information, please contact Jonathan Gordon, President/CEO or call 914.779.8200 x115
.
Availabilities
The Admiral Difference
Our Team
Admiral Real Estate Services Corp. is a commercial real estate brokerage firm offering retail and office leasing, tenant representation and investment sales services. Based in Westchester, the company currently lists and/or manages over 100 retail, office and development properties in the New York metropolitan area.
_________________________________________
.Tags: Inflation vs. Deflation, New York City suburbs, Westchester County commercial real estate, Fairfield County commercial real estate, Bronx County commercial real estate, Westchester investment sales, Fairfield County investment sales, Bronx investment sales
.